By Amy Katz, Conservation & GIS Manager
Welcome to From the Map Files, a new, recurring series of posts highlighting wildlife connectivity science, breaking down aspects of our internal programmatic processes, and sharing maps and data. In this first post, I’ll focus on the essential role that science plays in how we serve our land trust members at Heart of the Rockies Initiative, and in our Keep It Connected program, specifically.
The Keep It Connected program was created in 2021 to meet our land trust members’ need for greater capacity and capital in order to scale conservation of working lands that sustain wildlife movement and habitat. To answer this call, we created an online portfolio of current land trust projects that private foundations and philanthropists can browse and use to identify the most critical, ready-to-protect private lands that align with their values and organizational missions.
We present the projects in the portfolio to funders through compelling narratives, photos, and, using the best available science and data to describe the conservation value of the property, relevant maps that reflect wildlife connectivity in the region. Staying up to date on the background wildlife science and data takes time and connections that are not always available to our land trust partners, and in this way we also add capacity.
A significant aspect of my job as Conservation & GIS Manager is building and maintaining relationships with the people who create, disseminate, and hold the keys to wildlife data. I spend many mornings drinking coffee with university faculty, nonprofit staff, and state wildlife biologists. Over time, these acquaintances blossom into reciprocal relationships: as people trust us to use their data accurately and effectively, they also feel excited to share it with us as a mechanism for translating their work into on-the-ground conservation. Additionally, leaning on exclusively external, peer-reviewed research gives our program credibility.
It is a unique, gratifying niche to occupy, translating the science into tangible private land conservation. It is also a privilege not to be taken lightly. I firmly believe that maps can be deceiving, and that as cartographers and GIS professionals, we have a responsibility to be clear and honest with our donors, land trust members, and science partners about how we make decisions and display information. The goal of this series of posts is meant largely to do just that — transparently share how we gather and utilize the science that drives Keep It Connected.
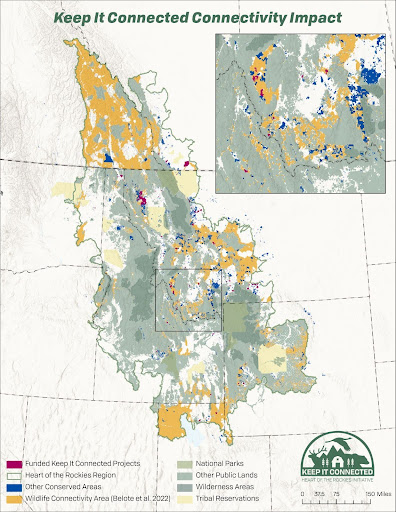
As an initial example, let me break down the most foundational piece of information we use: our species-agnostic connectivity model. This is the orange layer you see on each of our project maps, which reflects wildlife distribution throughout our region (see map below). It was essential to our process to develop a system of contextualizing and prioritizing projects via a landscape-wide demonstration of connectivity habitat.

Many connectivity models, especially those that do not focus on modeling paths of a specific species, rely on a technique called landscape resistance, which involves modeling least-cost movement paths, often between core protected areas. There are many biologists who are creating models using landscape resistance in various ways, including Travis Belote, PhD, Deputy Vice President of Science for the Wilderness Society. Travis recently developed a connectivity model using a newer software called Omniscape, which allows for analysis of important lands for maintaining connectivity across different spatial scales without having to determine core areas or start and end points. This technique eliminates a major source of bias toward animals moving mainly between larger protected areas.
I spoke in depth with Travis — and yes, drank coffee with him — about using this model to assess projects for our Keep It Connected program. Due to the flexible approach and the North America-wide modeling scale, it could accurately represent connectivity across our large service area. The analysis produced multiple connectivity surface layers, and he was able to guide me toward the one he felt was the most accurate. Once we had a layer chosen, we also had to make a decision about how to classify the layer — in other words, where do you determine the cutoff value that determines “good” connectivity? Again I relied on Travis to guide this decision, ultimately choosing the top third of the values. Clipping out the public lands, I ended up with a layer that prioritized connectivity on private lands across our entire service area. This is what you see on our maps; it is our first filter when we assess new land trust projects for connectivity value.
It is exciting to share the Keep It Connected process. As we develop this series over time, please do not hesitate to reach out to us if there are specific data or science questions you have.
 Amy Katz serves as Conservation & GIS Manager at Heart of the Rockies Initiative. As a trained cartographer, she uses her skills to map wildlife connectivity and other scientific data across the region to help prioritize conservation initiatives and serves our land trust members by providing insight into current science that affects their projects. Amy holds a bachelor’s degree in environmental studies from Bates College and a MS in environmental studies from the University of Montana, as well as a Natural Resource Conflict Resolution Certificate and a Geographic Information Program Certificate, both from University of Montana.


